祝贺硕士生周星辰同学水系锌离子电池正极材料的研究工作被Small Structures期刊接收! - 首页
Three-dimensional conductive interface and tip structure of MnO2 electrode facilitate superior zinc ion batteries
Abstract: Manganese dioxide has been significantly utilized in zinc ion batteries (ZIBs). However, in the rechargeable battery system, the manganese dioxide cathode suffers from poor conductivity, volume expansion, and substance dissolution, resulting in low capacity and poor stability. Herein, a 3D frame structure MnO2@CNTs cathode is proposed. In this system, the electrodeposited spherical MnO2 was anchored and interlinked via the in-situ growth carbon nanotubes (CNTs) onto the carbon cloth. Benefiting the unique 3D frame structure, the MnO2 structure crush problem and the pathway of the electronic and ions have been dramatically improved. The optimized MnO2@CNTs cathode demonstrate a high capacity of 256.35 mAh g-1 at 0.1 A g-1 and exceptional cycling stability. Furthermore, in-situ Raman spectroscopy elucidate the energy storage mechanism of aqueous ZIBs (AZIBs). Moreover, COMSOL finite elements analysis demonstrates that the petal edge-riched nanostructures of MnO2@CNTs generate a localized high electric field under constant current, accelerating ion/electron transfer. Our work explains the rationale for CNTs to improve the properties of MnO2 cathodes, providing a new perspective for the design of high-performance batteries.
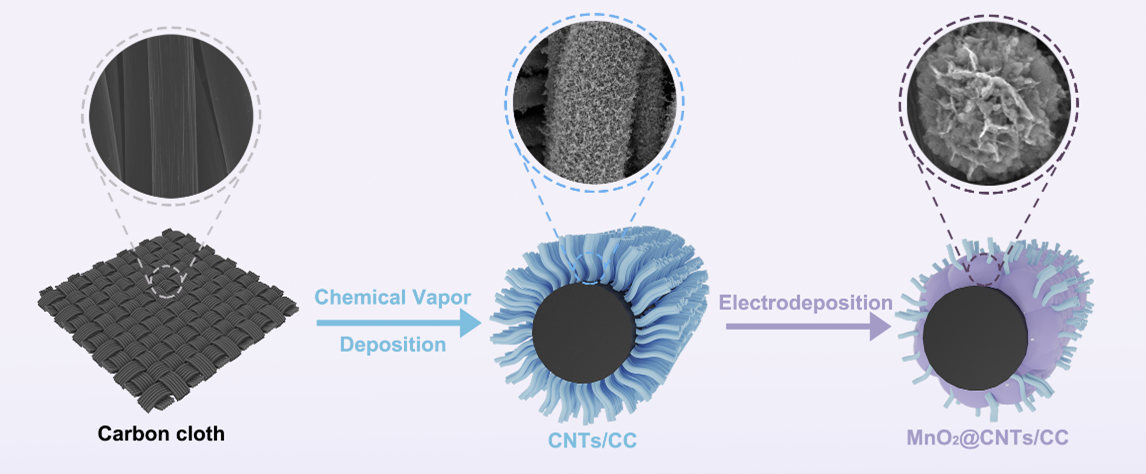
Schematic 1. The synthesis of MnO2@CNTs.

Figure 1. SEM images of a) CNTs@CC. b) CNTs. c) MnO2@CNTs after 5 min electrodeposition. d,e) MnO2@CNTs after 40 min electrodeposition. f) MnO2. g) TEM image. h) HRTEM image. i) Element mapping images of MnO2@CNTs.
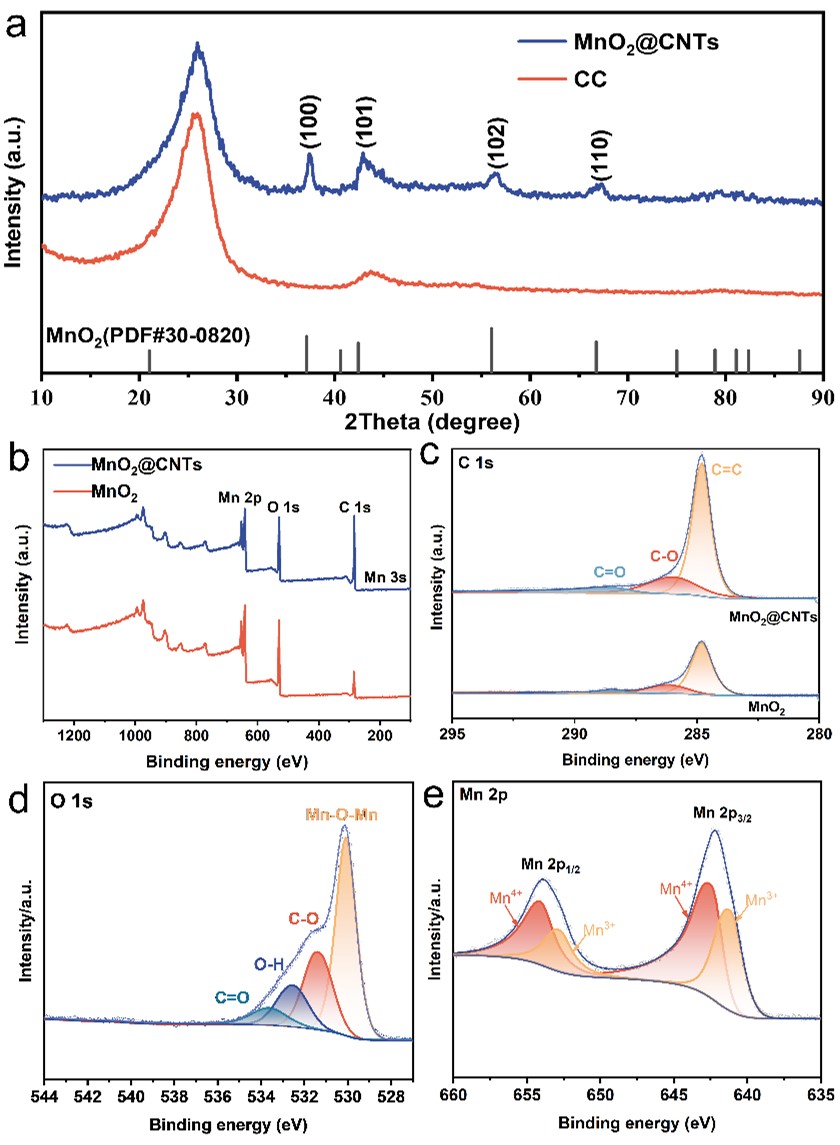
Figure 2 a) XRD patterns of MnO2@CNTs and CC. b) XPS spectra of MnO2@ CNTs. The fine XPS spectra for c) C 1s. d) O 1s. and e) Mn 2p.
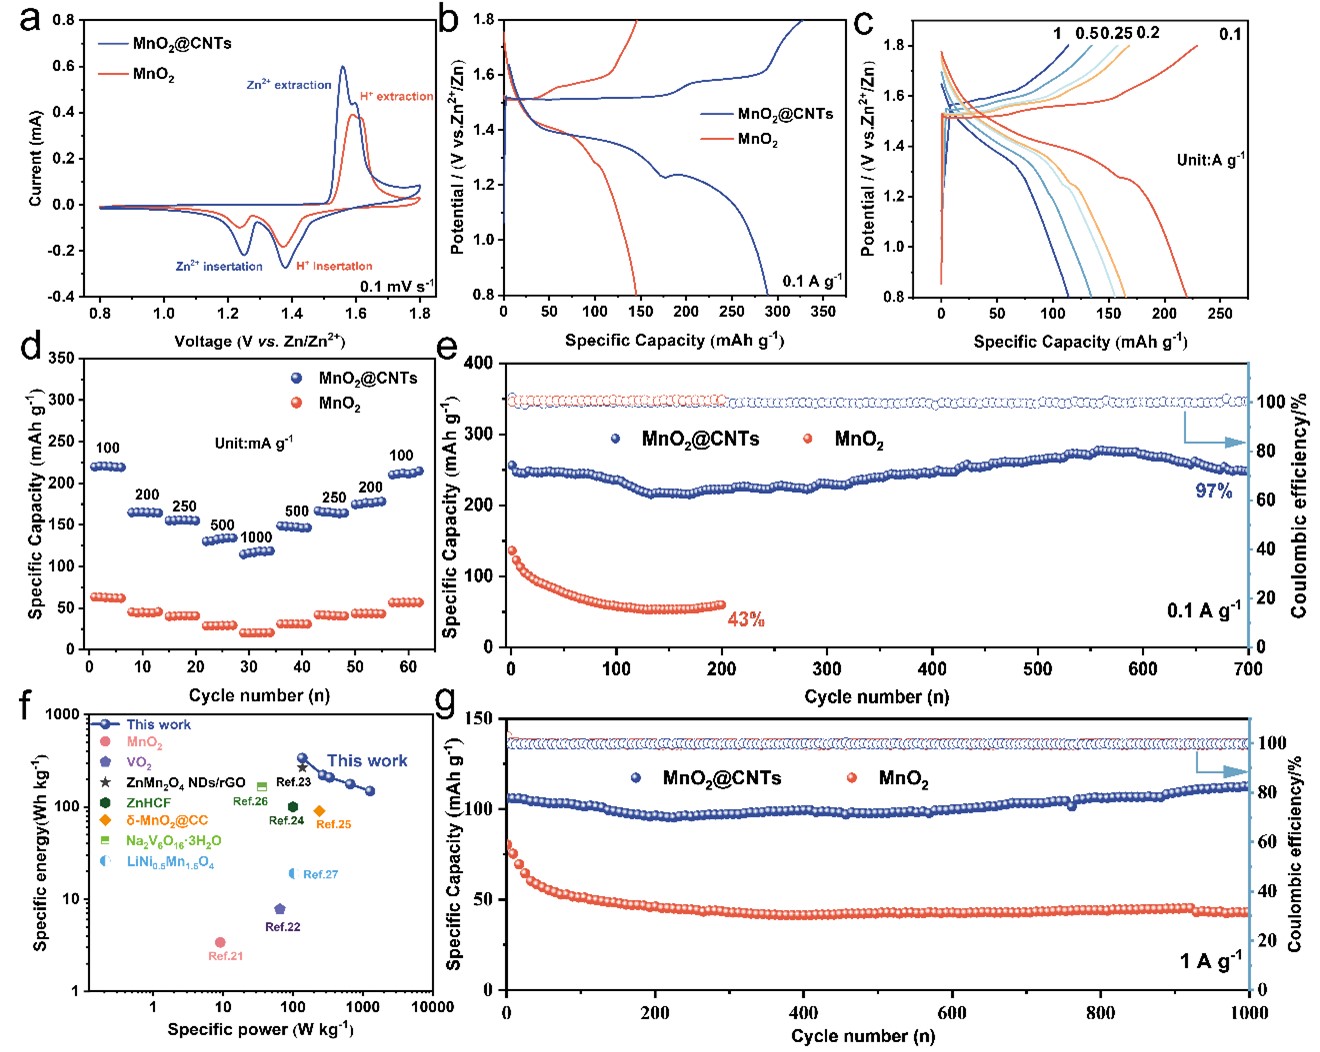
Figure 3. Electrochemical performances of MnO2@CNTs and MnO2 electrodes: a) CV curves at 0.1 mV s−1. b) GCD curves at 0.1 A g−1. c) GCD curves at different current densities. d) rate performance. e, g) long cycle performance at 0.1 A g-1 and 1 A g-1. f) Ragone plot.

Figure 4. MnO2@CNTs cathode a) CV curves of at different scan rates. b) log (i) versus log (v) plots at different peaks. c) Capacitive contributions at various scan rates. d) GITT curves. e) The ion diffusion coefficient of MnO2@CNTs and MnO2. f) Arrhenius plots for MnO2@CNTs and MnO2.

Figure 5. a-b) Free electron density distribution at the tip of MnO2@CNTs and MnO2. c-d) Computed electric field near the tip of MnO2@CNTs and MnO2. e-f) Zn2+ concentration at the tip of MnO2@CNTs and MnO2.

Figure 6. a-b) In-situ Raman spectral evolution of the MnO2@CNT during the discharging and charging processes. c) SEM of MnO2 after 1000th cycles; (d-e) SEM of MnO2@CNTs after 1000th cycles.
-
2024
03-11
-
2024
03-01
-
2023
11-21
-
2023
10-30
-
2023
10-17
-
2023
10-17
 (创新港)
(创新港)